The reasons why are not difficult to understand:
- MTA's light rail trains are much heavier than anything else on the road (no 225-ton motor vehicle would be allowed on the streets. The Army's Abrams Tank is comparatively 70 tons)
- MTA's light rail trains can't stop on a dime
- MTA's light rail trains don't have steering wheels, so they can't turn to avert or lessen impacts
- MTA's light rail trains have couplings at the front of the train (see below)

MTA tries to spin this fact primarily one of two ways: deceptively comparing raw data between cars and trains, and by using stats that tell nothing about the hazards street-level light rail vehicles pose to fellow motorists, pedestrians and cyclists.
1) MTA compares raw data between cars and trains.
MTA claims that significantly more people die from car accidents every day than light rail, thus "light rail is safer." But there are millions of vehicles on the road every day, while there are only 250 Blue Line trains during a week day, and only 185 during the weekend. The amount of Blue Line trains that travel across a busy intersection in Downtown LA in an entire day (250) is equal to the number of cars in just one lane of traffic, going in just one direction, across just one intersection in just 30 mins during rush hour. Simply, there are exponentially more cars on the road, so of course there are going to be more accidents and deaths with cars, just as there is sure to be more violent deaths in the Canada (population 33,000,000) than there are in Compton (population 95,000).
How hard would you laugh at the suggestion that Compton is safer than Canada?
2) MTA uses passenger mile accident/fatality rate statistics instead of train mile accident/fatality rate statistics.
Train miles is the distance a train travels, while passenger miles is the combined distance passengers on the train have traveled.
For example, if one Blue Line carrying 50 passengers travels 10 miles it will have traveled:
10 train miles, and
500 passenger miles (50 passengers X 10 miles = 500 passenger miles)
If the train has one accident, the accident rate is 1 accident per 500 passenger miles, which looks a lot safer than 1 accident per 10 train miles.
But a 3-car train carrying 10 people will kill a pedestrian, motorist or cyclist just as dead as a train carrying 100 people.
MTA's spin tactics regarding the hazards of at-grade rail are a statement to their desperation and deception in selling these street-level projects. At Fix Expo, we believe in dealing with reality. We believe the increased hazard of light rail trains requires increased safety mitigation measures, especially grade separation in dense urban areas, which requires a capital investment that our politicians are not currently willing to make (unless you're a city like Culver City that will threaten to oppose the project legally or politically).
Instead, MTA pushes at-grade rail and forces local cities and communities to fight for upgrades, all so they can give the appearance of doing something about traffic. (In reality they're making it worse!). Simply, our politicians have falsely translated our region's desires for traffic relief into a light rail system built on the cheap and unsafely. It is a culture that does not value lives.
(UPDATE: We composed a flyer comparing the accident and fatality rates of roads, freeways, light rail and commuter rail.)500 passenger miles (50 passengers X 10 miles = 500 passenger miles)
If the train has one accident, the accident rate is 1 accident per 500 passenger miles, which looks a lot safer than 1 accident per 10 train miles.
But a 3-car train carrying 10 people will kill a pedestrian, motorist or cyclist just as dead as a train carrying 100 people.
MTA's spin tactics regarding the hazards of at-grade rail are a statement to their desperation and deception in selling these street-level projects. At Fix Expo, we believe in dealing with reality. We believe the increased hazard of light rail trains requires increased safety mitigation measures, especially grade separation in dense urban areas, which requires a capital investment that our politicians are not currently willing to make (unless you're a city like Culver City that will threaten to oppose the project legally or politically).
Instead, MTA pushes at-grade rail and forces local cities and communities to fight for upgrades, all so they can give the appearance of doing something about traffic. (In reality they're making it worse!). Simply, our politicians have falsely translated our region's desires for traffic relief into a light rail system built on the cheap and unsafely. It is a culture that does not value lives.
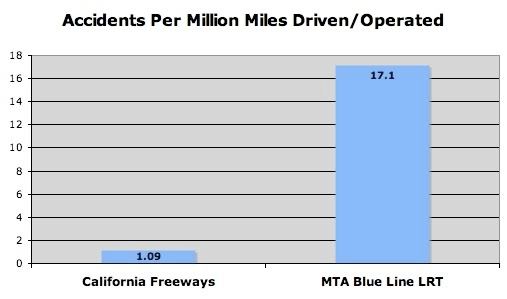
- Blue Line accident rate from the June 2008 MTA Summary of Metro Blue Line Train/Vehicle and Train/Pedestrian Accidents (July 1990 - June 2008)
- Freeway accident rate is from CalTrans, as reported by the LA Times' Steve Hymon: link